Creating charts in Excel is very simple and therefore extremely popular. It gives you amazing data processing capabilities as well as the vastness of types and formats of charts.
However, if the person to whom we are to send the chart, or the application where it is to be used does not support the Excel format, it seems that our only solution is to export chart to a graphic file, e.g. png or jpeg. Well, there is another way - export the chart directly to the PDF format.
PDF is a format created by Adobe. It is practically a standard when it comes to the format of read-only documents. This makes it ideal for exchanging charts between applications.
Here's how to save any type of chart from Excel to PDF.
-
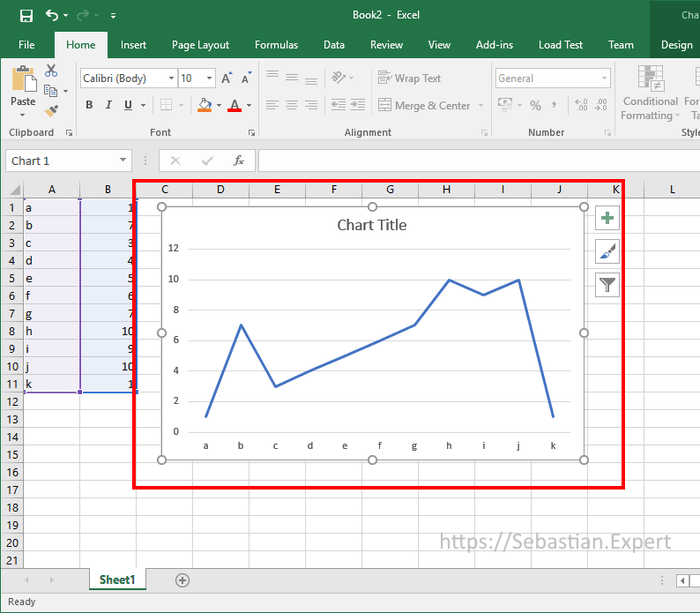
Select graph you would like to save

-
Click File
-
Go to Save As and choose where to save the file
-
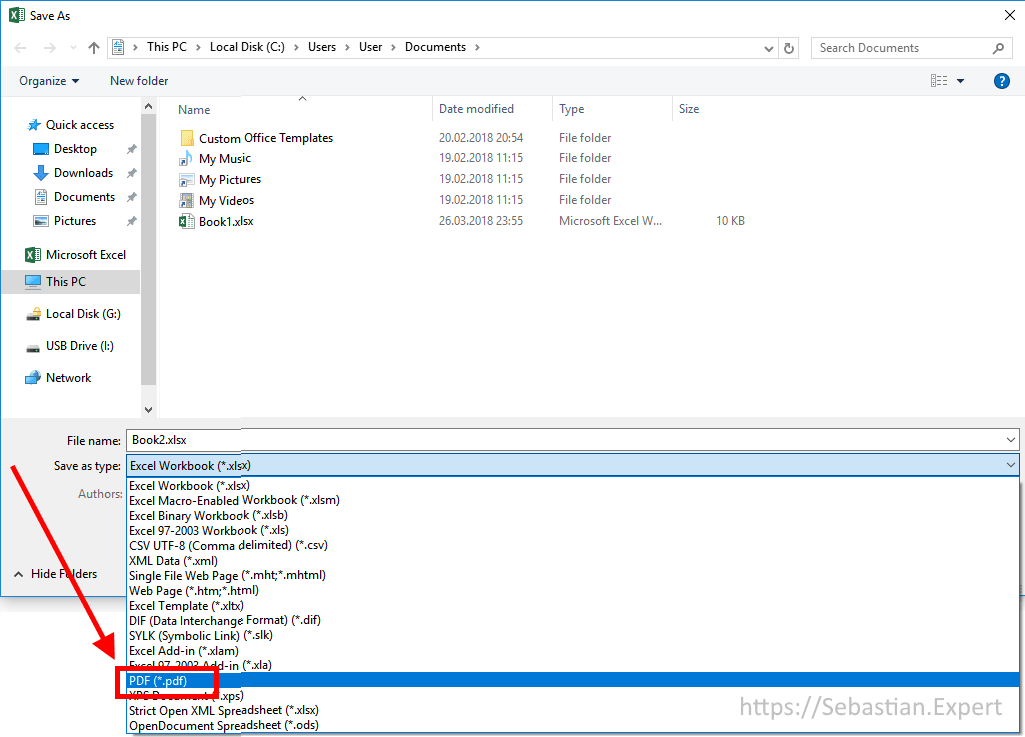
In save dialog, choose PDF (*.pdf) extension
Click to enlarge -
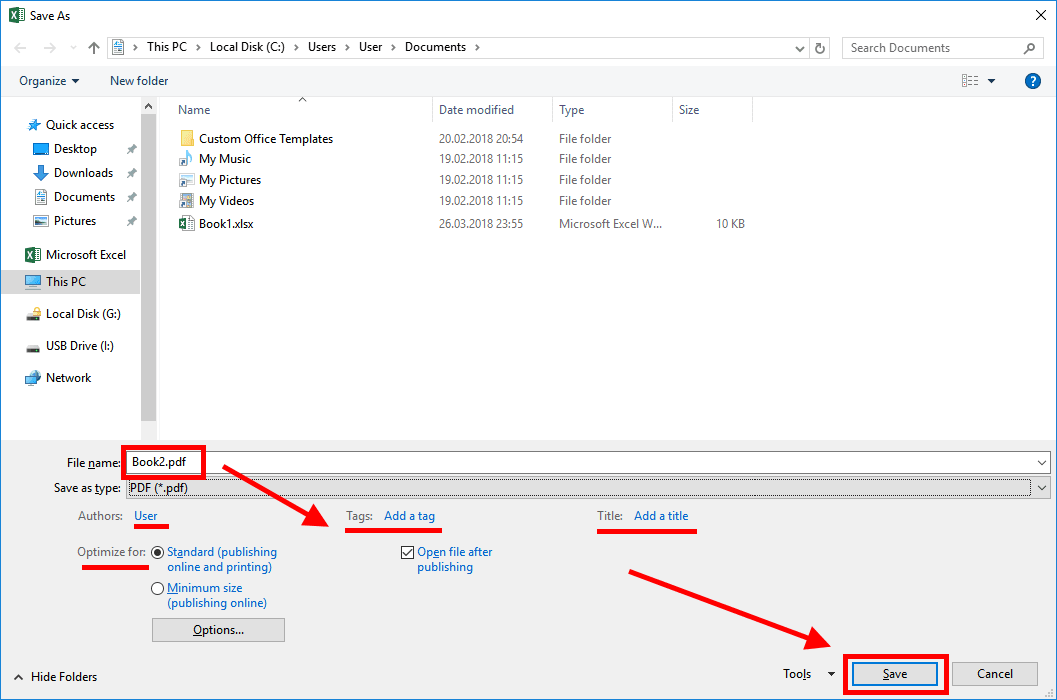
Verify path and file name and click Save
-
After successfully saving the file PDF with graph, it will be opened in the default PDF reader. Now you can insert it into any application you need.
Click to enlarge